
這是「偵錯 Attribution Reporting」系列文章的第 2 部分,設定偵錯報告。
詞彙
- 報表來源是設定歸因報表來源和觸發條件標頭的來源。瀏覽器產生的所有報表都會傳送至這個來源。在本指南中,我們使用
https://adtech.example做為報表來源範例。 - 「歸因報表」 (簡稱「報表」) 是最終報表 (事件層級或可匯總),內含您要求的評估資料。
- 偵錯報表包含歸因報表或來源/觸發事件的其他相關資料。收到偵錯報表不一定代表有運作錯誤!偵錯報表分為兩種類型
- 「轉換偵錯報表」是一種偵錯報表,需要設定 Cookie 才能產生及傳送。假如沒有設定 Cookie 且第三方 Cookie 淘汰,轉換偵錯報表將一併停止提供。本指南介紹的所有偵錯報表都是轉換偵錯報表。
- 成功偵錯報表會追蹤成功產生歸因報表。這類指標與歸因報表直接相關。成功偵錯報表自 Chrome 101 版 (2022 年 4 月) 起提供。
- 詳細偵錯報表可追蹤缺漏報表,協助您判斷為何缺少這些報表。指出瀏覽器未記錄來源或觸發事件的情況 (這表示系統不會產生歸因報表),以及因故無法產生或傳送歸因報表的情況。詳細偵錯報表包含
type欄位,說明來源事件、觸發事件或歸因報表未產生的原因。自 Chrome 109 版開始提供詳細偵錯報表 (2023 年 1 月推出穩定版)。 - 偵錯金鑰是可在來源端和觸發端設定的專屬 ID。偵錯金鑰可讓您對應 Cookie 型轉換和歸因型轉換。設定系統產生偵錯報表並設定偵錯金鑰後,瀏覽器會將這些偵錯金鑰納入所有歸因報表和偵錯報表。
如要進一步瞭解我們說明文件中使用的更多概念和重要詞彙,請參閱「Privacy Sandbox 詞彙」。
導入相關問題
如果在設定偵錯報告時遇到任何問題,請在開發人員支援存放區中建立問題,我們會協助您排解疑難。
準備設定偵錯報告
設定偵錯報告前,請按照下列步驟操作:
確認您已採用 API 整合最佳做法
確認程式碼是否受到功能偵測機制保護。如要確保 API 不會遭到 Permissions-Policy 封鎖,請執行下列程式碼:
if (document.featurePolicy.allowsFeature('attribution-reporting')) {
// the Attribution Reporting API is enabled
}
如果這項功能偵測檢查傳回 true,表示 API 可在執行檢查的環境 (網頁) 中使用。
(測試階段不需執行此步驟:請確認您已設定 Permissions-Policy)
修正基本整合問題
雖然偵錯報告有助於大規模偵測及分析損失,但有些整合問題可以在本機偵測到。如果來源和觸發標頭設定錯誤、JSON 剖析發生問題、環境不安全 (非 HTTPS),以及其他導致 API 無法運作的問題,都會顯示在 開發人員工具的「問題」分頁中。
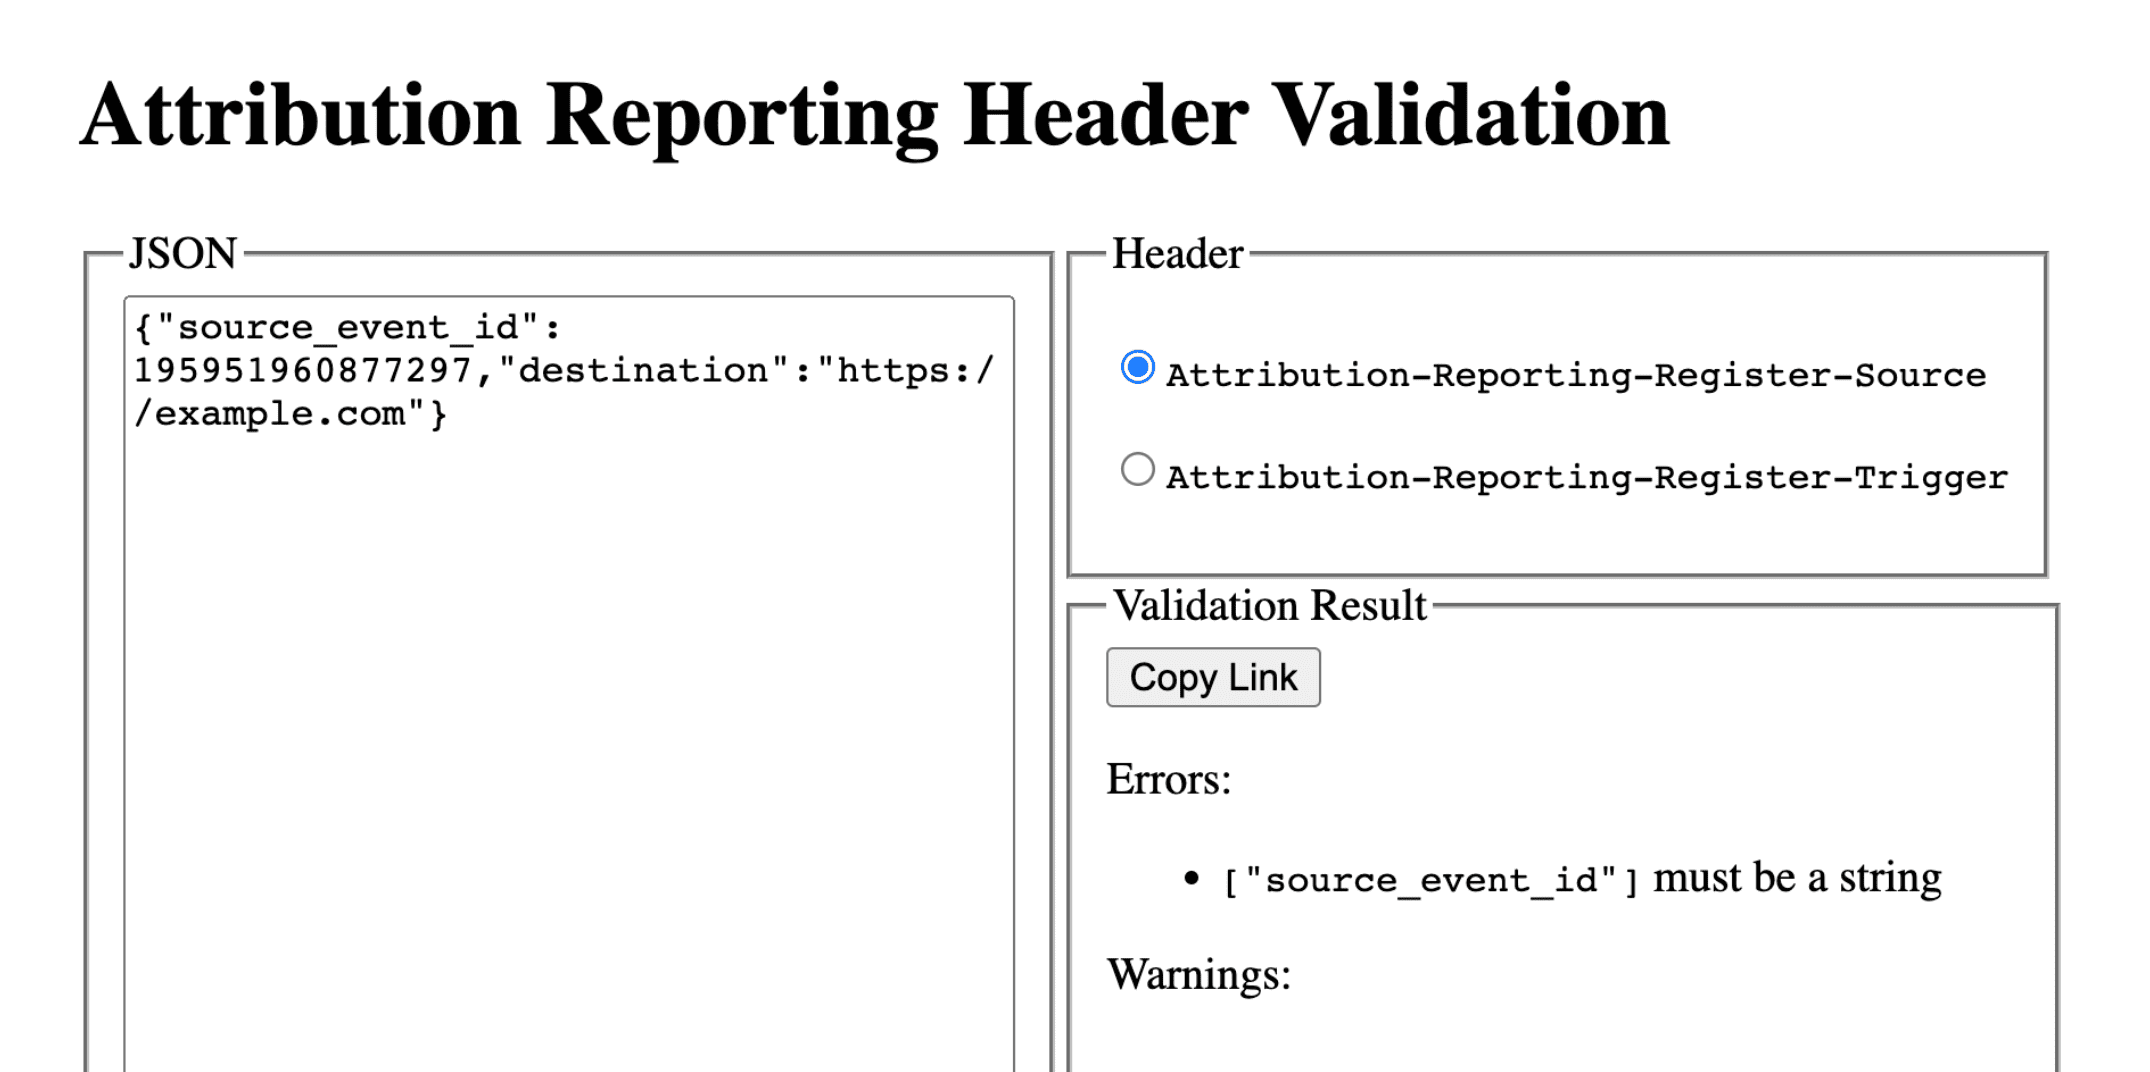
開發人員工具問題的類型可能不同。如果遇到invalid header問題,請將標頭複製到標頭驗證工具。這有助於找出並修正導致問題的欄位。
驗證歸因報表標頭
您可以使用標頭驗證工具,驗證與 Attribution Reporting API 相關的標頭。您可以監控瀏覽器發生的驗證錯誤,以便進行 API 偵錯。
如要選擇接收偵錯報表,請在 Attribution-Reporting-Info 回應標頭中加入 report-header-errors。
Attribution-Reporting-Info: report-header-errors
請注意,Attribution-Reporting-Info 是字典結構的標頭Attribution-Reporting-Info,因此提供布林值 report-header-errors 鍵即表示值為 true。
偵錯報表會立即傳送至回報端點:
https://<reporting origin>/.well-known/attribution-reporting/debug/verbose
要求主體會以 JSON 物件清單的形式包含報表資料,格式如下:
[{
  "type": "header-parsing-error",
  "body": {
    "context_site": "https://source.example",
    "header": "Attribution-Reporting-Register-Source",
    "value": "!!!", // header value received in the response
    "error": "invalid JSON" // optional error details that may vary across browsers or different versions of the same browser
  }
}]
設定偵錯報表:歸因成功報表和詳細報表的通用步驟
在報表來源中設定下列 Cookie:
Set-Cookie: ar_debug=1; SameSite=None; Secure; Path=/; HttpOnly
瀏覽器會在來源和觸發條件登錄時檢查是否有這個 Cookie。只有在兩次都有 Cookie 的情況下,系統才會產生成功偵錯報表。
請注意,您可以在模式 B 的瀏覽器中啟用偵錯報表,其中第三方 Cookie 已停用,方便您測試及為淘汰第三方 Cookie 做好準備。如果是模式 B 的瀏覽器,您不需要設定偵錯 Cookie 即可啟用偵錯報告。跳至步驟 2,設定成功偵錯報表的偵錯金鑰。
步驟 2:設定偵錯金鑰
每個偵錯金鑰都必須是採十進位字串格式的 64 位元無正負號整數。請為每個偵錯金鑰設定專屬 ID。只有在設定偵錯金鑰時,系統才會產生成功偵錯報表。
- 將來源端偵錯金鑰對應至您認為有助於偵錯的其他來源端資訊。
- 將觸發端偵錯鍵對應至您認為有助於偵錯的其他觸發時間資訊。
舉例來說,您可以設定下列偵錯鍵:
- Cookie ID + 來源時間戳記做為來源偵錯鍵 (並在以 Cookie 為準的系統中擷取相同時間戳記)
- Cookie ID + 觸發時間戳記做為觸發偵錯鍵 (並在以 Cookie 為基礎的系統中擷取相同時間戳記)
這樣一來,您就能使用以 Cookie 為準的轉換資訊,查詢對應的偵錯報表或歸因報表。詳情請參閱第 3 部分:食譜。
請將來源端的偵錯金鑰設為與 source_event_id 不同,這樣您就能區分具有相同來源事件 ID 的個別報表。
Attribution-Reporting-Register-Source:
{
// … Usual fields for Attribution-Reporting-Register-Source
"debug_key":"647775351539539"
}
Attribution-Reporting-Register-Trigger:
{
// … Usual fields for Attribution-Reporting-Register-Trigger
"debug_key":"938321351539743"
}
設定成功偵錯報表
本節中的程式碼範例會產生事件層級和可彙整報表的成功偵錯報表。事件層級和可匯總報表使用相同的偵錯鍵。
步驟 3:設定端點,收集成功偵錯報告
設定端點來收集偵錯報表。這個端點應與主要歸因端點類似,路徑中會多出 debug 字串:
- 事件層級成功偵錯報表的端點:
https://adtech.example/.well-known/attribution-reporting/debug/report-event-attribution- 可匯總成功偵錯報表的端點:
https://adtech.example/.well-known/attribution-reporting/debug/report-aggregate-attribution
- 可匯總成功偵錯報表的端點:
當歸因觸發時,瀏覽器會立即使用 POST 要求,將偵錯報告傳送至這個端點。您的伺服器程式碼可能如下所示,可處理傳入的成功偵錯報告 (以下為節點端點):
// Handle incoming event-Level Success Debug reports
adtech.post(
  '/.well-known/attribution-reporting/debug/report-event-attribution',
  async (req, res) => {
    // Debug report is in req.body
    res.sendStatus(200);
  }
);

// Handle incoming aggregatable Success Debug reports
adtech.post(
  '/.well-known/attribution-reporting/debug/report-aggregate-attribution',
  async (req, res) => {
    // Debug report is in req.body
    res.sendStatus(200);
  }
);
步驟 4:確認設定會產生成功偵錯報告
- 在瀏覽器中開啟
chrome://attribution-internals。 - 請務必在「事件層級報表」和「可匯總報表」分頁中,勾選「顯示偵錯報表」核取方塊。
- 開啟您已導入歸因報表的網站。完成產生歸因報表的步驟,這些步驟也會產生成功偵錯報表。
- 在
chrome://attribution-internals中:- 確認已正確產生出價策略報表。
- 在「事件層級報表」和「可匯總報表」分頁中,確認系統也產生了成功偵錯報表。在清單中,以藍色
debug路徑辨識這些項目。
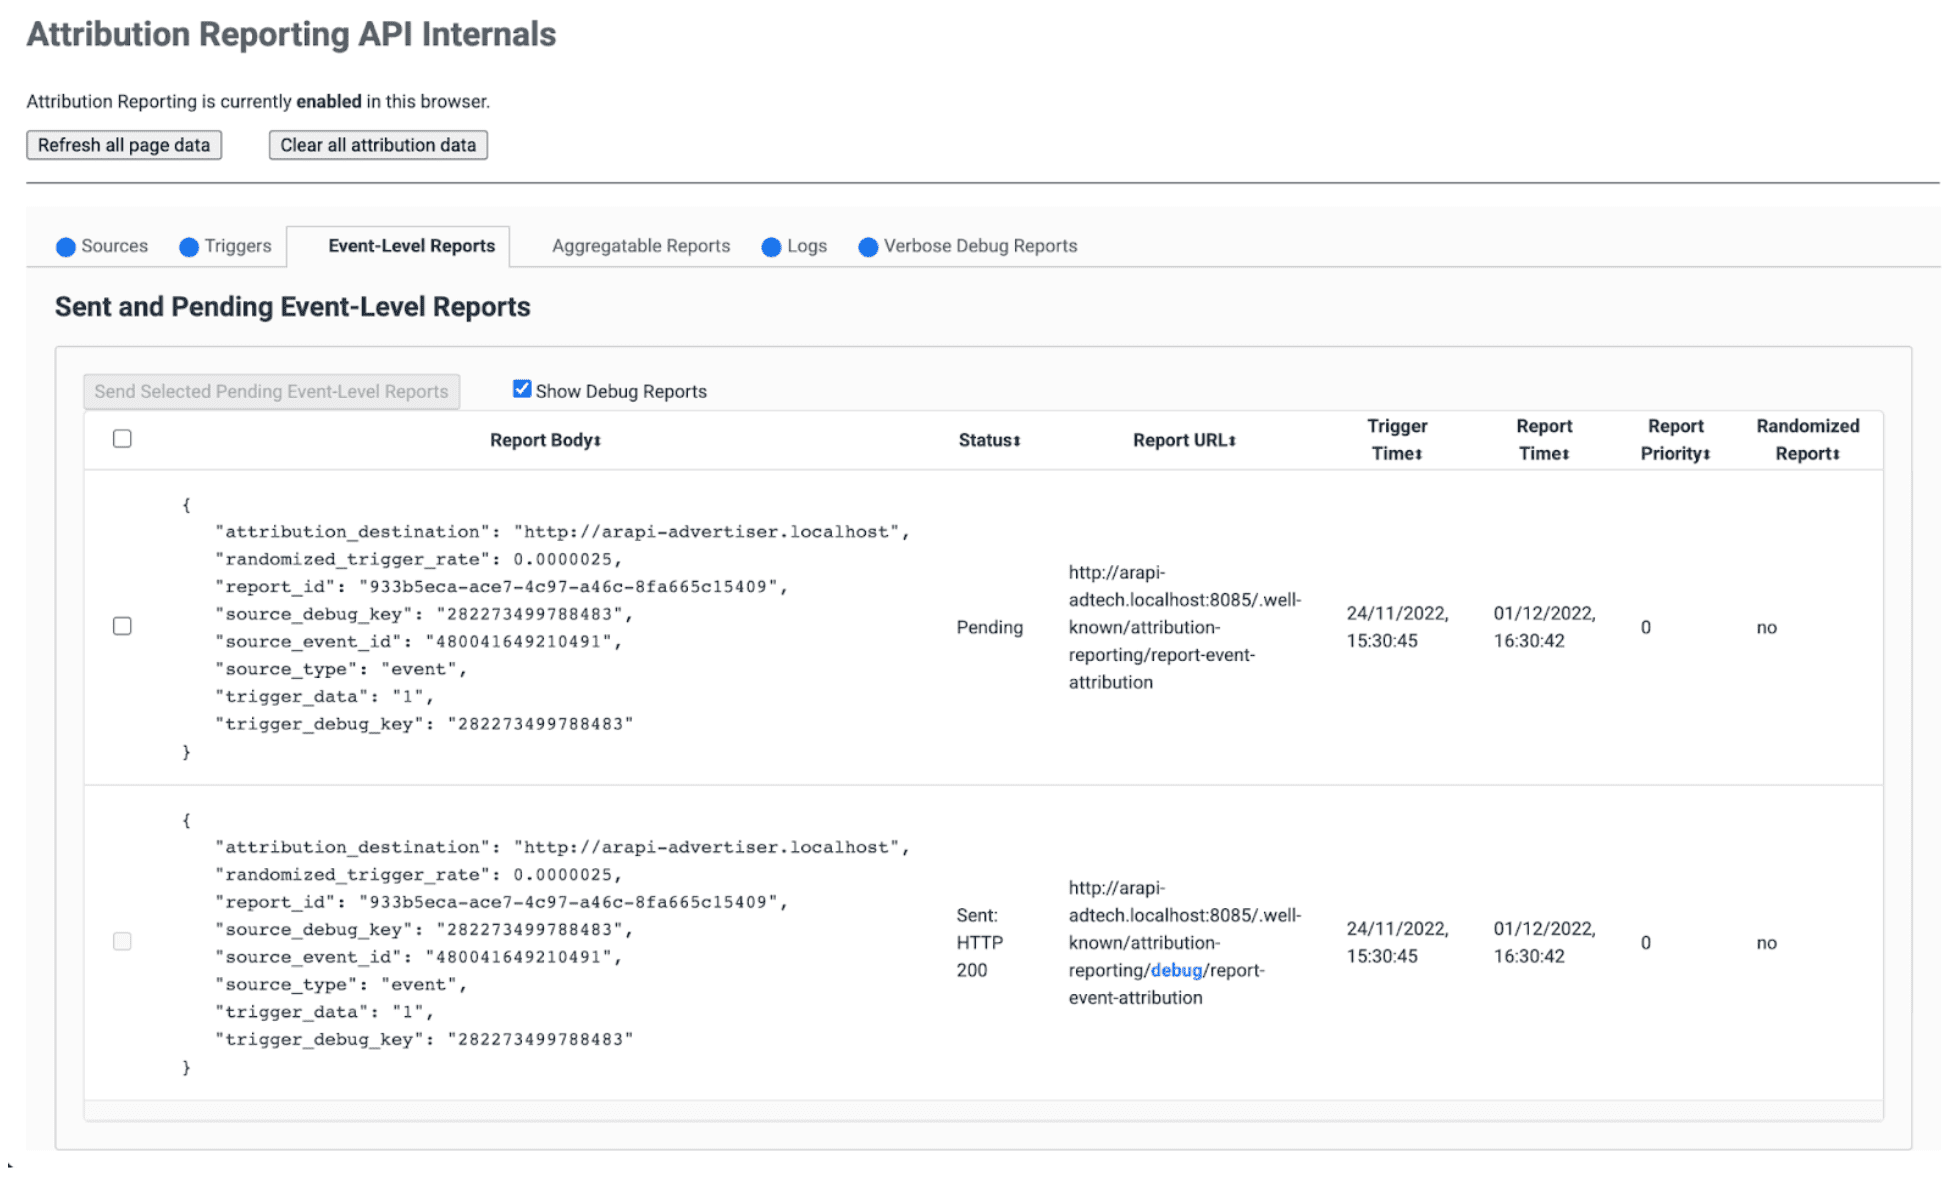
- 在伺服器上,確認端點會立即收到這些成功偵錯報表。請務必檢查事件層級和可彙整的成功偵錯報表。
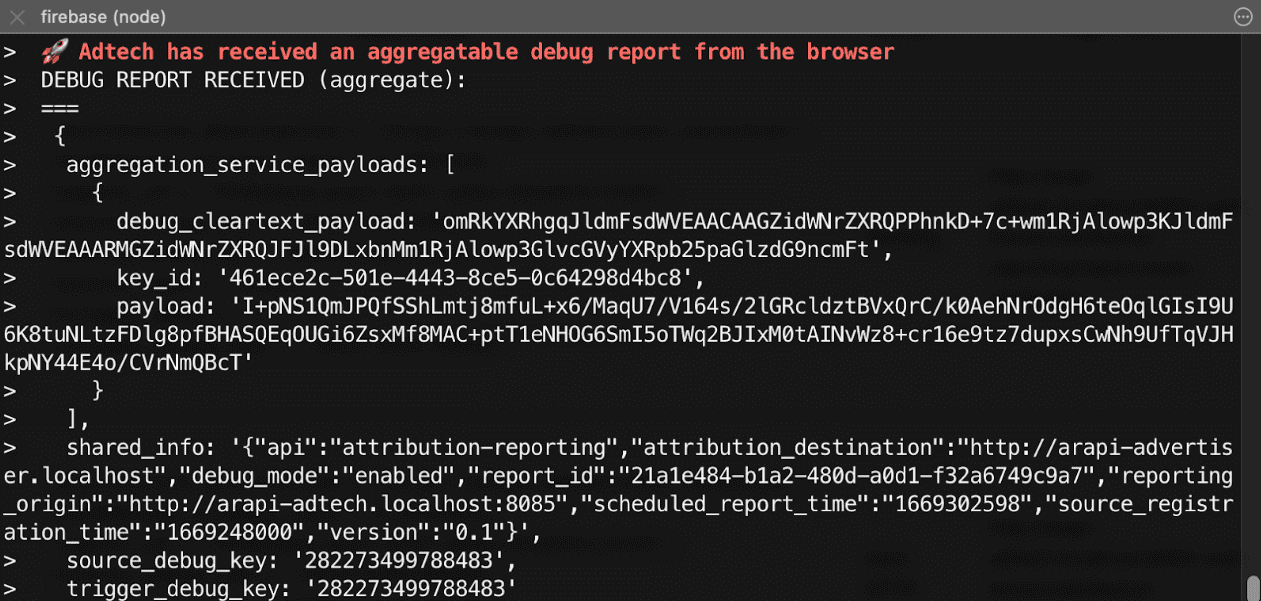
步驟 5:觀察成功偵錯報表
歸因成功偵錯報表與歸因報表相同,包含來源端和觸發端偵錯金鑰。
{
  "attribution_destination": "https://advertiser.example",
  "randomized_trigger_rate": 0.0000025,
  "report_id": "7d76ef29-d59e-4954-9fff-d97a743b4715",
  "source_debug_key": "647775351539539",
  "source_event_id": "760938763735530",
  "source_type": "event",
  "trigger_data": "0",
  "trigger_debug_key": "156477391437535"
}
{
  "aggregation_service_payloads": [
    {
      "debug_cleartext_payload": "omRkYXRhgqJldmFsdWVEAACAAGZidWNrZXRQPPhnkD+7c+wm1RjAlowp3KJldmFsdWVEAAARMGZidWNrZXRQJFJl9DLxbnMm1RjAlowp3GlvcGVyYXRpb25paGlzdG9ncmFt",
      "key_id": "d5f32b96-abd5-4ee5-ae23-26490d834012",
      "payload": "0s9mYVIuznK4WRV/t7uHKquHPYCpAN9mZHsUGNiYd2G/9cg87Y0IjlmZkEtiJghMT7rmg3GtWVPWTJU5MvtScK3HK3qR2W8CVDmKRAhqqlz1kPZfdGUB4NsXGyVCy2UWapklE/r7pmRDDP48b4sQTyDMFExQGUTE56M/8WFVQ0qkc7UMoLI/uwh2KeIweQCEKTzw"
    }
  ],
  "shared_info": "{\"api\":\"attribution-reporting\",\"attribution_destination\":\"https://advertiser.example\",\"debug_mode\":\"enabled\",\"report_id\":\"4a04f0ff-91e7-4ef6-9fcc-07d000c20495\",\"reporting_origin\":\"https://adtech.example\",\"scheduled_report_time\":\"1669888617\",\"source_registration_time\":\"1669852800\",\"version\":\"0.1\"}",
  "source_debug_key": "647775351539539",
  "trigger_debug_key": "156477391437535"
}
設定詳細偵錯報表
步驟 3:在來源和觸發標頭中選擇詳細偵錯
在 Attribution-Reporting-Register-Source 和 Attribution-Reporting-Register-Trigger 中,將 debug_reporting 設為 true。
Attribution-Reporting-Register-Source:
{
// … Usual fields for Attribution-Reporting-Register-Source
"debug_key":"938321351539743",
"debug_reporting": true // defaults to false if not present
}

Attribution-Reporting-Register-Trigger:
{
// … Usual fields for Attribution-Reporting-Register-Trigger
"debug_key":"938321351539743",
"debug_reporting": true // defaults to false if not present
}
步驟 4:設定端點,收集詳細的偵錯報告
設定端點來收集偵錯報表。這個端點應與主要歸因端點類似,路徑中會多出 debug/verbose 字串:
https://adtech.example/.well-known/attribution-reporting/debug/verbose
產生詳細偵錯報表時 (也就是未註冊來源或觸發條件時),瀏覽器會立即使用 POST 要求,將詳細偵錯報表傳送到這個端點。處理傳入詳細偵錯報告的伺服器程式碼可能如下所示 (這裡是在節點端點上):
// Handle incoming verbose debug reports
adtech.post(
  '/.well-known/attribution-reporting/debug/verbose',
  async (req, res) => {
    // List of verbose debug reports is in req.body
    res.sendStatus(200);
  }
);
與成功偵錯報表不同,詳細報表只有一個端點。 與事件層級和匯總報表相關的詳細報表,都會傳送至相同端點。
步驟 5:確認設定會產生詳細的偵錯報告
詳細偵錯報表類型眾多,但您只需一種詳細偵錯報表,即可檢查詳細偵錯設定。如果系統能正確產生並接收這類詳細偵錯報表,表示系統也能正確產生並接收所有類型的詳細偵錯報表,因為所有詳細偵錯報表都使用相同的設定,且會傳送到相同的端點。
- 在瀏覽器中開啟
chrome://attribution-internals。 - 在已設定歸因報表的網站上觸發歸因 (轉換)。由於這項轉換前沒有任何廣告參與 (曝光或點擊),因此系統應會產生詳細的偵錯報表 (類型為
trigger-no-matching-source)。 - 在
chrome://attribution-internals中,開啟「詳細偵錯報表」分頁,並確認已產生trigger-no-matching-source類型的詳細偵錯報表。 - 在伺服器上,確認端點已立即收到這份詳細的偵錯報告。
步驟 6:查看詳細偵錯報表
在觸發事件發生時產生的詳細偵錯報表,會同時包含來源端和觸發事件端的偵錯金鑰 (如果觸發事件有相符的來源)。在來源時間產生的詳細偵錯報表會包含來源端偵錯金鑰。
以下是瀏覽器傳送的要求範例,其中包含詳細偵錯報表:
[
  {
    "body": {
      "attribution_destination": "http://arapi-advertiser.localhost",
      "randomized_trigger_rate": 0.0000025,
      "report_id": "92b7f4fd-b157-4925-999e-aad6361de759",
      "source_debug_key": "282273499788483",
      "source_event_id": "480041649210491",
      "source_type": "event",
      "trigger_data": "1",
      "trigger_debug_key": "282273499788483"
    },
    "type": "trigger-event-low-priority"
  },
  {
    "body": {
      "attribution_destination": "http://arapi-advertiser.localhost",
      "limit": "65536",
      "source_debug_key": "282273499788483",
      "source_event_id": "480041649210491",
      "source_site": "http://arapi-publisher.localhost",
      "trigger_debug_key": "282273499788483"
    },
    "type": "trigger-aggregate-insufficient-budget"
  }
]
每份詳細報表都包含以下欄位:
Type- 產生報表的原因。如要瞭解所有詳細報表類型,以及根據每種類型應採取的行動,請參閱「第 3 部分:偵錯食譜」中的詳細報表參考資料。
Body- 報表內文。視類型而定。請參閱第 3 部分:偵錯食譜中的詳細報表參考資料。
要求主體至少會包含一份詳細報表,最多兩份:
- 如果失敗只影響事件層級報表 (或只影響可匯總報表),則為一份詳細報表。來源或觸發事件登錄失敗的原因只有一個,因此每個失敗事件和每種報表類型 (事件層級或可匯總) 都會產生一份詳細報表。
- 如果失敗影響事件層級和匯總報表,則會產生兩份詳細報表。但如果事件層級和匯總報表的失敗原因相同,則只會產生一份詳細報表 (例如:
trigger-no-matching-source)