
アトリビューション レポートのデバッグに関する 3 部構成のパート 2。デバッグ レポートを設定します。
用語集
- レポート送信元は、Attribution Reporting の「ソース」ヘッダーとトリガー ヘッダーを設定する送信元です。ブラウザによって生成されたすべてのレポートは、このオリジンに送信されます。このガイダンスでは、レポート送信元の例として
https://adtech.exampleを使用します。 - アトリビューション レポート(レポート)は、リクエストした測定データを含む最終的なレポート(イベントレベルまたは集計可能)です。
- デバッグ レポートには、アトリビューション レポート、ソースイベント、トリガー イベントに関する追加データが含まれます。デバッグ レポートを受け取っても、必ずしも正しく動作していないわけではありません。2 種類のデバッグ レポート
- 移行デバッグ レポートは、生成と送信のために Cookie の設定が必要なデバッグ レポートです。Cookie が設定されていない場合、およびサードパーティ Cookie のサポートが終了すると、移行デバッグ レポートは利用できなくなります。このガイドで説明するデバッグ レポートはすべて移行デバッグ レポートです。
- 成功デバッグ レポートでは、アトリビューション レポートの正常な生成を追跡できます。アトリビューション レポートと直接関連しています。成功デバッグ レポートは、Chrome 101(2022 年 4 月)から利用できます。
- 詳細なデバッグ レポートは、欠落しているレポートを追跡し、欠落している理由を特定するのに役立ちます。ブラウザがソースイベントまたはトリガー イベントを記録しなかった(つまりアトリビューション レポートを生成しない)ケースと、なんらかの理由でアトリビューション レポートを生成または送信できないケースを示します。詳細なデバッグ レポートには、ソースイベント、トリガー イベント、アトリビューション レポートが生成されなかった理由を示す
typeフィールドが含まれています。詳細なデバッグ レポートは、Chrome 109(2023 年 1 月の安定版)からご利用いただけます。 - デバッグキーは、ソース側とトリガー側の両方で設定できる一意の識別子です。デバッグキーを使用すると、Cookie ベースのコンバージョンとアトリビューション ベースのコンバージョンをマッピングできます。デバッグ レポートを生成し、デバッグキーを設定するようにシステムをセットアップすると、ブラウザのすべてのアトリビューション レポートとデバッグ レポートにこれらのデバッグキーが含まれるようになります。
ドキュメント全体で使用されているコンセプトと主な用語については、プライバシー サンドボックスの用語集をご覧ください。
実装に関する質問
デバッグ レポートの設定中に問題が発生した場合は、デベロッパー サポート リポジトリで問題を作成してください。トラブルシューティングをサポートします。
デバッグ レポートの設定の準備をする
デバッグ レポートを設定する前に、次の手順を行います。
API 統合のベスト プラクティスを適用していることを確認する
コードがフィーチャー検出の背後でゲートされていることを確認します。API が Permissions-Policy によってブロックされていないことを確認するには、次のコードを実行します。
if (document.featurePolicy.allowsFeature('attribution-reporting')) {
// the Attribution Reporting API is enabled
}
この機能検出チェックが true を返した場合、チェックが実行されたコンテキスト(ページ)で API が許可されます。
(テストフェーズでは必須ではありません。Permissions-Policy を設定していることを確認してください)
統合に関する根本的な問題を修正する
デバッグ レポートは、大規模な損失を検出して分析するのに役立ちますが、一部の統合の問題はローカルで検出できます。ソースとトリガーのヘッダーの構成ミス、JSON の解析に関する問題、安全でないコンテキスト(非 HTTPS)など、API の機能が妨げられる問題は、デベロッパー ツールの [問題] タブに表示されます。
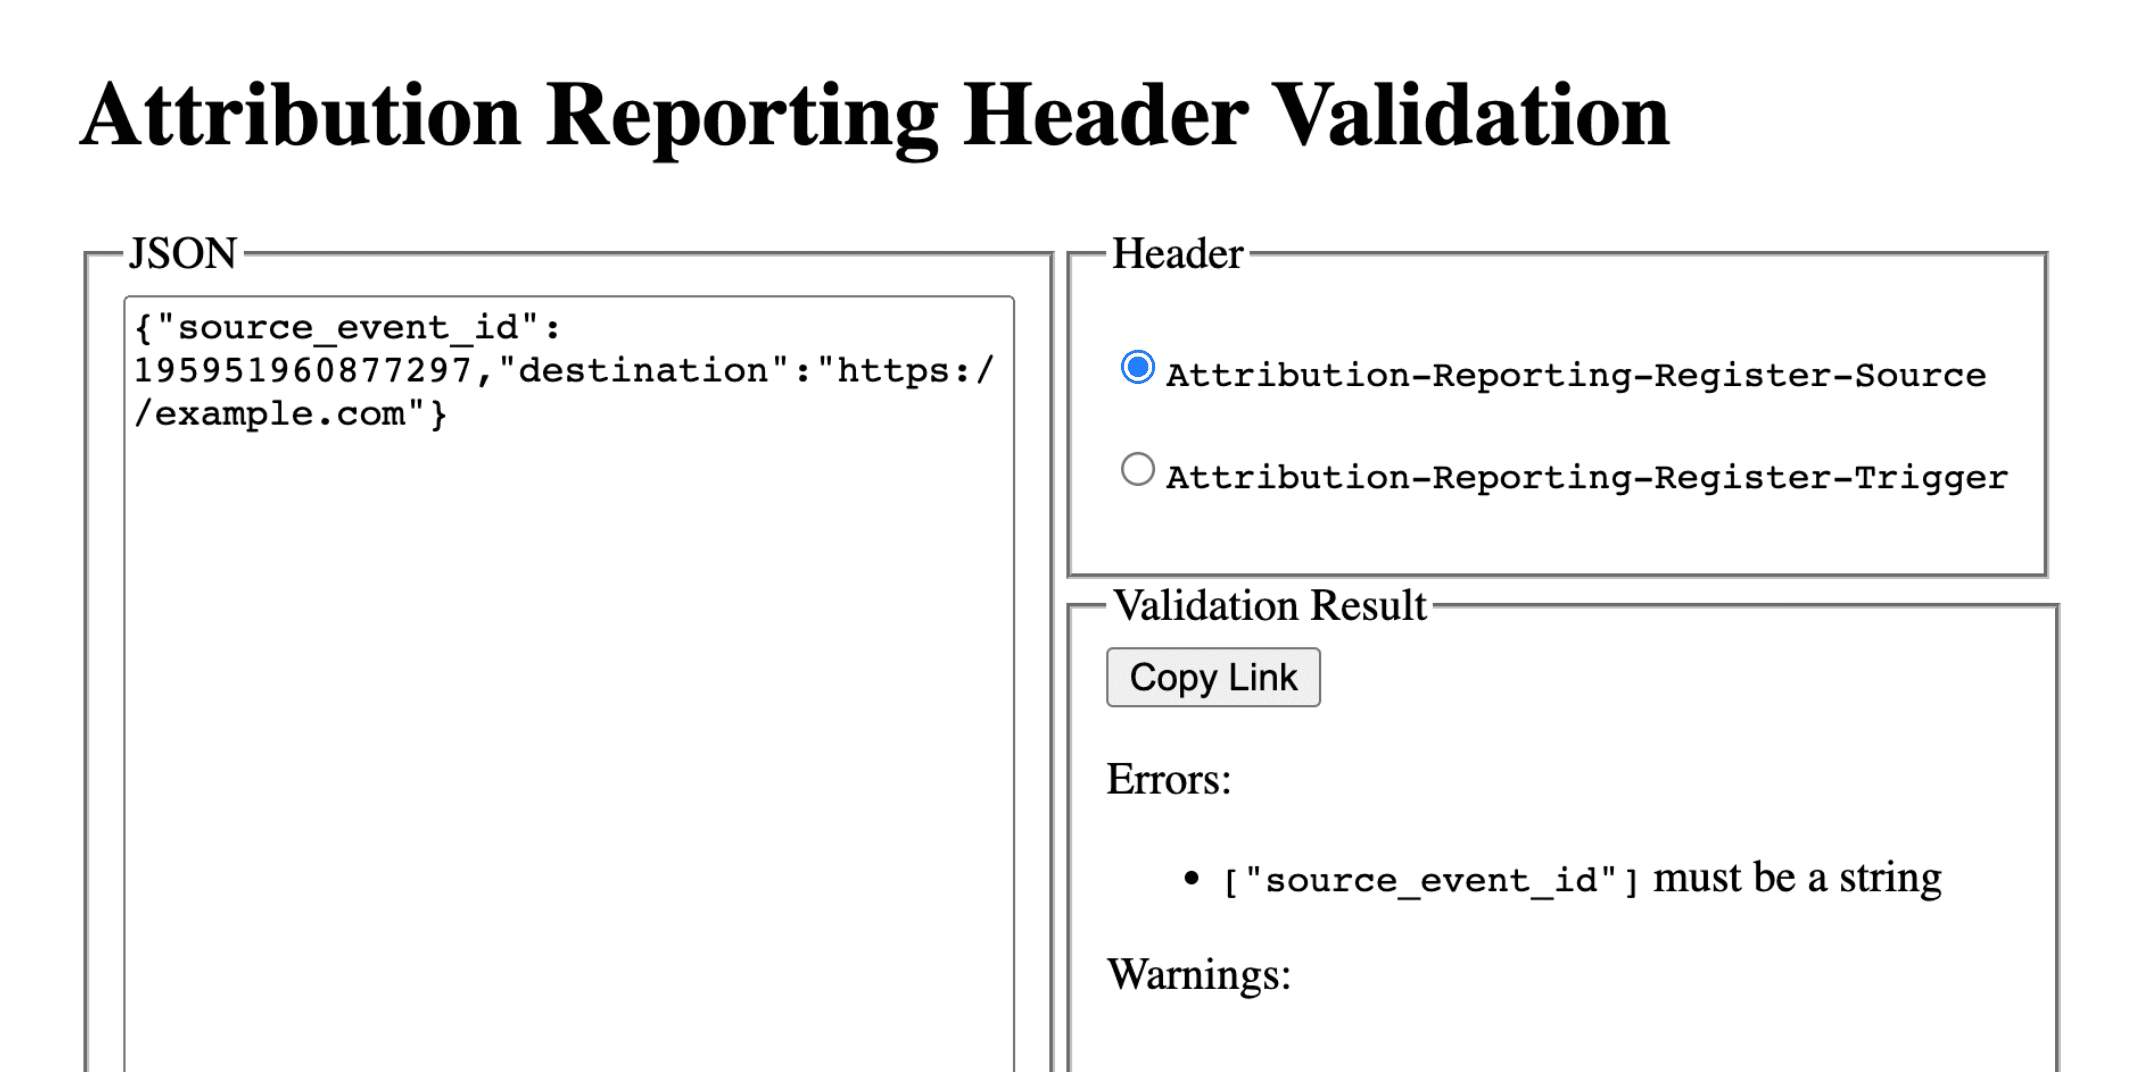
DevTools の問題にはさまざまな種類があります。invalid header の問題が発生した場合は、ヘッダーをヘッダー検証ツールにコピーします。これにより、問題の原因となっているフィールドを特定して修正できます。
アトリビューション レポート ヘッダーを検証する
ヘッダー バリデータを使用すると、Attribution Reporting API に関連するヘッダーを検証できます。ブラウザで発生した検証エラーをモニタリングして、API のデバッグを容易にすることができます。
デバッグ レポートの受信を有効にするには、Attribution-Reporting-Info レスポンス ヘッダーの一部として report-header-errors を指定して応答します。
Attribution-Reporting-Info: report-header-errors
Attribution-Reporting-Info は辞書構造のヘッダーAttribution-Reporting-Info であるため、ブール値の report-header-errors キーを指定すると、true 値が指定されたことになります。
デバッグ レポートは、レポート エンドポイントに直ちに送信されます。
https://<reporting origin>/.well-known/attribution-reporting/debug/verbose
レポートデータは、次の形式のオブジェクトの JSON リストとしてリクエストの本文に含まれます。
[{
  "type": "header-parsing-error",
  "body": {
    "context_site": "https://source.example",
    "header": "Attribution-Reporting-Register-Source",
    "value": "!!!", // header value received in the response
    "error": "invalid JSON" // optional error details that may vary across browsers or different versions of the same browser
  }
}]
デバッグ レポートを設定する: 成功レポートと詳細レポートに共通する手順
レポート送信元に次の Cookie を設定します。
Set-Cookie: ar_debug=1; SameSite=None; Secure; Path=/; HttpOnly
ブラウザは、ソースとトリガーの両方の登録でこの Cookie の存在を確認します。成功デバッグ レポートは、両方の時点で Cookie が存在する場合にのみ生成されます。
デバッグ レポートは、サードパーティ Cookie のサポート終了に向けたテストと準備を容易にするためにサードパーティ Cookie が無効になっているモード B のブラウザで有効にできます。モード B のブラウザでは、デバッグ レポートを有効にするためにデバッグ Cookie を設定する必要はありません。成功デバッグ レポートのデバッグキーを設定するには、ステップ 2 に進みます。
ステップ 2: デバッグキーを設定する
各デバッグキーは、10 進数文字列としてフォーマットされた 64 ビットの符号なし整数でなければなりません。各デバッグキーを一意の ID にします。デバッグキーが設定されている場合にのみ、成功デバッグ レポートが生成されます。
- ソース側のデバッグキーを、デバッグに関連すると思われる追加のソース時情報にマッピングします。
- トリガー側のデバッグキーを、デバッグに関連すると思われる追加のトリガー時情報にマッピングします。
たとえば、次のようなデバッグキーを設定できます。
- Cookie ID + ソース タイムスタンプをソース デバッグキーとして使用(Cookie ベースのシステムで同じタイムスタンプをキャプチャ)
- Cookie ID + トリガー タイムスタンプをトリガー デバッグキーとして使用(同じタイムスタンプを Cookie ベースのシステムで取得)
これにより、Cookie ベースのコンバージョン情報を使用して、対応するデバッグ レポートやアトリビューション レポートを検索できます。詳しくは、パート 3: クックブックをご覧ください。
ソース側のデバッグキーを source_event_id と異なるものにすると、同じソースイベント ID を持つ個々のレポートを区別できます。
Attribution-Reporting-Register-Source:
{
// … Usual fields for Attribution-Reporting-Register-Source
"debug_key":"647775351539539"
}
Attribution-Reporting-Register-Trigger:
{
// … Usual fields for Attribution-Reporting-Register-Trigger
"debug_key":"938321351539743"
}
デモコード: ソース デバッグキー デモコード: トリガー デバッグキー
成功のデバッグ レポートを設定する
このセクションのサンプルコードは、イベントレベル レポートと集計可能レポートの両方で成功のデバッグ レポートを生成します。イベントレベル レポートと集計可能レポートでは同じデバッグキーが使用されます。
ステップ 3: 成功のデバッグ レポートを収集するエンドポイントを設定する
デバッグ レポートを収集するエンドポイントを設定します。このエンドポイントは、メインのアトリビューション エンドポイントと似ていますが、パスに debug 文字列が追加されています。
- イベントレベルの成功デバッグ レポートのエンドポイント:
https://adtech.example/.well-known/attribution-reporting/debug/report-event-attribution- 集約可能な成功デバッグ レポートのエンドポイント:
https://adtech.example/.well-known/attribution-reporting/debug/report-aggregate-attribution
- 集約可能な成功デバッグ レポートのエンドポイント:
アトリビューションがトリガーされると、ブラウザは POST リクエストを使用して、このエンドポイントにデバッグ レポートをすぐに送信します。受信した成功デバッグ レポートを処理するサーバーコードは、次のようになります(ここではノード エンドポイント)。
// Handle incoming event-Level Success Debug reports
adtech.post(
  '/.well-known/attribution-reporting/debug/report-event-attribution',
  async (req, res) => {
    // Debug report is in req.body
    res.sendStatus(200);
  }
);

// Handle incoming aggregatable Success Debug reports
adtech.post(
  '/.well-known/attribution-reporting/debug/report-aggregate-attribution',
  async (req, res) => {
    // Debug report is in req.body
    res.sendStatus(200);
  }
);
デモコード: イベントレベルのデバッグ レポートのエンドポイント
ステップ 4: セットアップで成功のデバッグ レポートが生成されることを確認する
- ブラウザで
chrome://attribution-internalsを開きます。 - [イベントレベル レポート] タブと [集計可能レポート] タブの両方で、[デバッグ レポートを表示] チェックボックスがオンになっていることを確認します。
- アトリビューション レポートを実装したサイトを開きます。アトリビューション レポートを生成する手順を完了します。この手順で、成功のデバッグ レポートも生成されます。
chrome://attribution-internalsで以下を実行します。- アトリビューション レポートが正しく生成されていることを確認します。
- [イベントレベル レポート] タブと [集計可能レポート] タブで、成功のデバッグ レポートも生成されていることを確認します。青色の
debugパスでリストに表示されます。
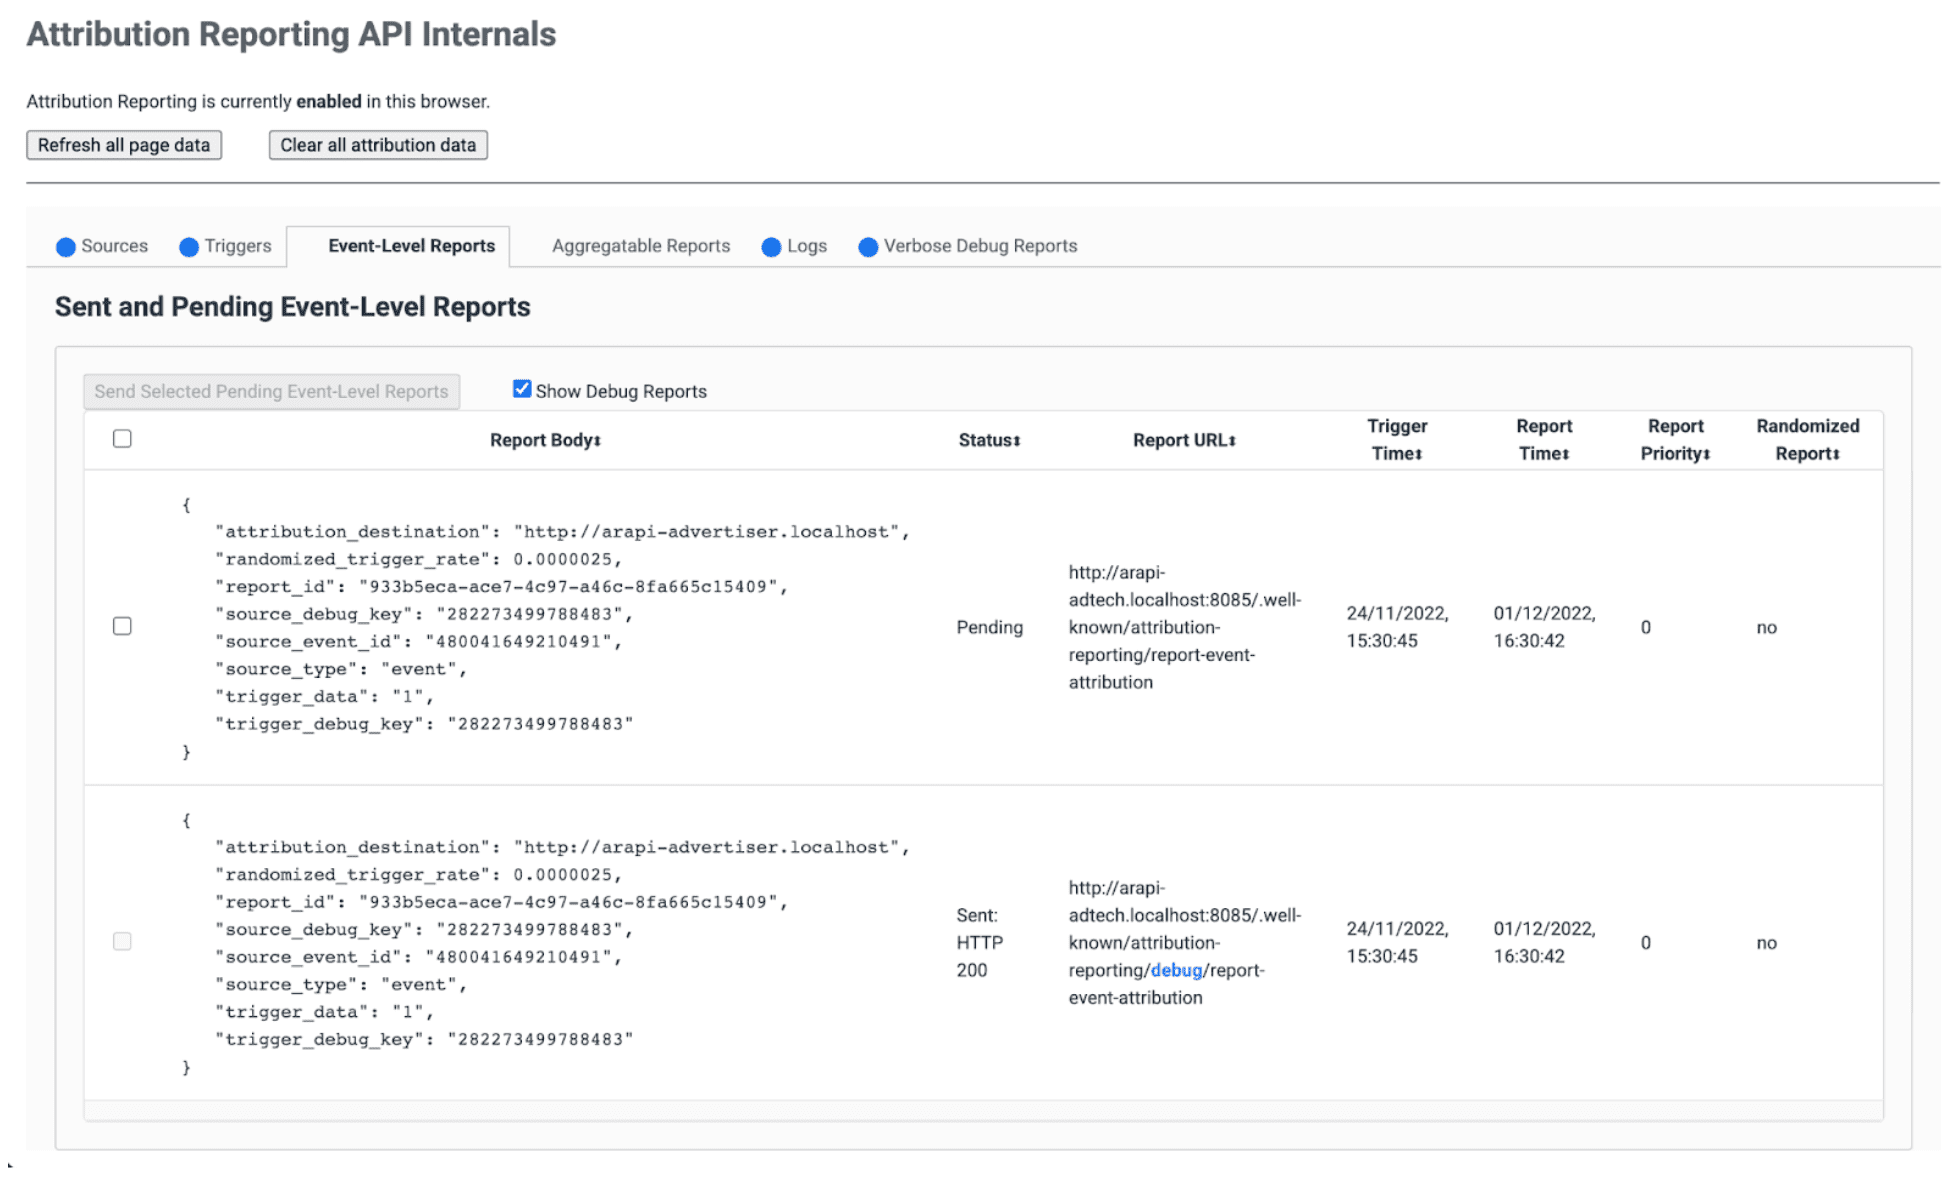
- サーバーで、エンドポイントがこれらの成功デバッグ レポートを直ちに受信することを確認します。イベントレベルと集計可能の両方の成功デバッグ レポートを確認してください。
ステップ 5: 成功のデバッグ レポートを確認する
成功デバッグ レポートはアトリビューション レポートと同じで、ソース側とトリガー側の両方のデバッグキーが含まれています。
{
  "attribution_destination": "https://advertiser.example",
  "randomized_trigger_rate": 0.0000025,
  "report_id": "7d76ef29-d59e-4954-9fff-d97a743b4715",
  "source_debug_key": "647775351539539",
  "source_event_id": "760938763735530",
  "source_type": "event",
  "trigger_data": "0",
  "trigger_debug_key": "156477391437535"
}
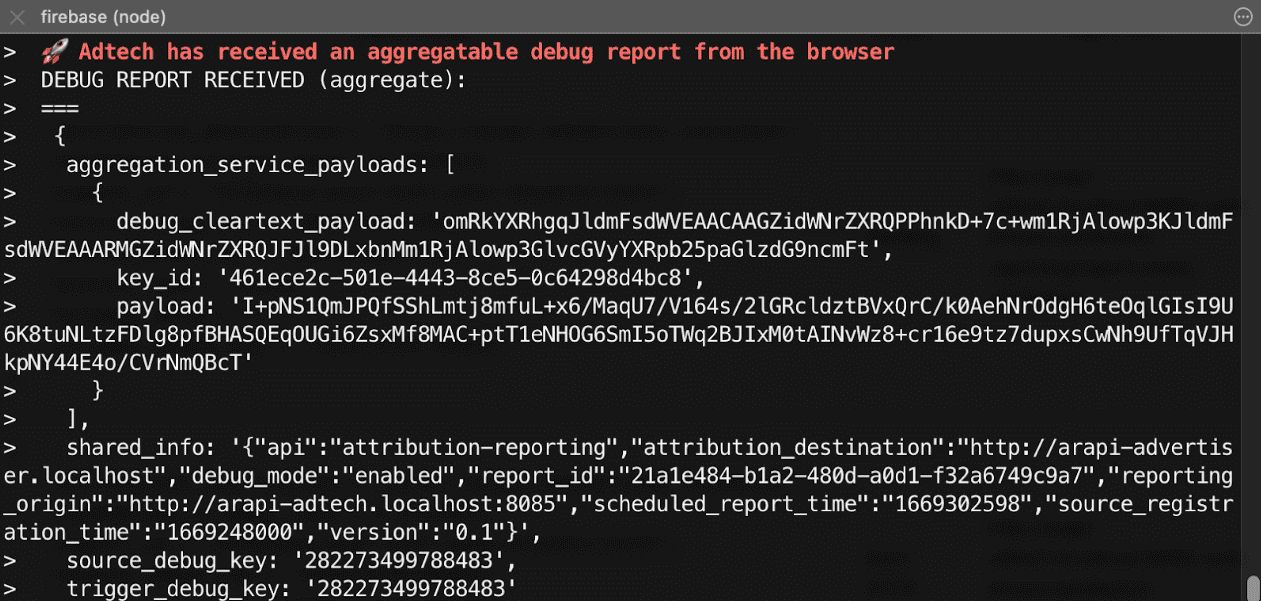
{
  "aggregation_service_payloads": [
    {
      "debug_cleartext_payload": "omRkYXRhgqJldmFsdWVEAACAAGZidWNrZXRQPPhnkD+7c+wm1RjAlowp3KJldmFsdWVEAAARMGZidWNrZXRQJFJl9DLxbnMm1RjAlowp3GlvcGVyYXRpb25paGlzdG9ncmFt",
      "key_id": "d5f32b96-abd5-4ee5-ae23-26490d834012",
      "payload": "0s9mYVIuznK4WRV/t7uHKquHPYCpAN9mZHsUGNiYd2G/9cg87Y0IjlmZkEtiJghMT7rmg3GtWVPWTJU5MvtScK3HK3qR2W8CVDmKRAhqqlz1kPZfdGUB4NsXGyVCy2UWapklE/r7pmRDDP48b4sQTyDMFExQGUTE56M/8WFVQ0qkc7UMoLI/uwh2KeIweQCEKTzw"
    }
  ],
  "shared_info": "{\"api\":\"attribution-reporting\",\"attribution_destination\":\"https://advertiser.example\",\"debug_mode\":\"enabled\",\"report_id\":\"4a04f0ff-91e7-4ef6-9fcc-07d000c20495\",\"reporting_origin\":\"https://adtech.example\",\"scheduled_report_time\":\"1669888617\",\"source_registration_time\":\"1669852800\",\"version\":\"0.1\"}",
  "source_debug_key": "647775351539539",
  "trigger_debug_key": "156477391437535"
}
詳細なデバッグ レポートを設定する
ステップ 3: ソースとトリガー ヘッダーで詳細なデバッグを有効にする
Attribution-Reporting-Register-Source と Attribution-Reporting-Register-Trigger の両方で debug_reporting を true に設定します。
Attribution-Reporting-Register-Source:
{
// … Usual fields for Attribution-Reporting-Register-Source
"debug_key":"938321351539743",
"debug_reporting": true // defaults to false if not present
}

Attribution-Reporting-Register-Trigger:
{
// … Usual fields for Attribution-Reporting-Register-Trigger
"debug_key":"938321351539743",
"debug_reporting": true // defaults to false if not present
}
ステップ 4: 詳細なデバッグ レポートを収集するエンドポイントを設定する
デバッグ レポートを収集するエンドポイントを設定します。このエンドポイントは、メインのアトリビューション エンドポイントと似ていますが、パスに debug/verbose 文字列が追加されています。
https://adtech.example/.well-known/attribution-reporting/debug/verbose
詳細なデバッグ レポートが生成されると(ソースまたはトリガーが登録されていない場合)、ブラウザは POST リクエストを使用して、このエンドポイントに詳細なデバッグ レポートをすぐに送信します。詳細なデバッグ レポートを受信するためのサーバーコードは、次のようになります(ここではノード エンドポイント)。
// Handle incoming verbose debug reports
adtech.post(
  '/.well-known/attribution-reporting/debug/verbose',
  async (req, res) => {
    // List of verbose debug reports is in req.body
    res.sendStatus(200);
  }
);
成功デバッグ レポートとは異なり、詳細レポートのエンドポイントは 1 つだけです。イベントレベル レポートと集計レポートに関連する詳細レポートはすべて同じエンドポイントに送信されます。
ステップ 5: 詳細なデバッグ レポートが生成されることを確認する
詳細デバッグ レポートにはさまざまな種類がありますが、詳細デバッグの設定を確認するには、詳細デバッグ レポートのいずれか 1 種類で十分です。この 1 種類の詳細デバッグ レポートが正しく生成されて受信された場合、すべての詳細デバッグ レポートが正しく生成されて受信されることになります。これは、すべての詳細デバッグ レポートが同じ構成を使用し、同じエンドポイントに送信されるためです。
- ブラウザで
chrome://attribution-internalsを開きます。 - Attribution Reporting で設定されたサイトでアトリビューション(コンバージョン)をトリガーします。このコンバージョンの前に広告エンゲージメント(インプレッションまたはクリック)がなかったため、
trigger-no-matching-sourceタイプの詳細なデバッグ レポートが生成されることが予想されます。 chrome://attribution-internalsで、[詳細なデバッグ レポート] タブを開き、trigger-no-matching-sourceタイプの詳細なデバッグ レポートが生成されていることを確認します。- サーバーで、エンドポイントがこの詳細なデバッグ レポートをすぐに受け取ったことを確認します。
ステップ 6: 詳細なデバッグ レポートを確認する
トリガー時に生成される詳細なデバッグ レポートには、ソース側のデバッグキーとトリガー側のデバッグキーの両方が含まれます(トリガーに一致するソースがある場合)。ソース時に生成される詳細なデバッグ レポートには、ソース側のデバッグキーが含まれます。
ブラウザから送信された、詳細なデバッグ レポートを含むリクエストの例:
[
  {
    "body": {
      "attribution_destination": "http://arapi-advertiser.localhost",
      "randomized_trigger_rate": 0.0000025,
      "report_id": "92b7f4fd-b157-4925-999e-aad6361de759",
      "source_debug_key": "282273499788483",
      "source_event_id": "480041649210491",
      "source_type": "event",
      "trigger_data": "1",
      "trigger_debug_key": "282273499788483"
    },
    "type": "trigger-event-low-priority"
  },
  {
    "body": {
      "attribution_destination": "http://arapi-advertiser.localhost",
      "limit": "65536",
      "source_debug_key": "282273499788483",
      "source_event_id": "480041649210491",
      "source_site": "http://arapi-publisher.localhost",
      "trigger_debug_key": "282273499788483"
    },
    "type": "trigger-aggregate-insufficient-budget"
  }
]
詳細レポートには、次のフィールドが含まれています。
Type- レポートが生成された原因。すべての詳細レポートのタイプと、各タイプに応じて行うべきアクションについては、パート 3: デバッグのクックブックの詳細レポートのリファレンスをご覧ください。
Body- レポートの本文。タイプによって異なります。パート 3: デバッグ クックブックで詳細レポートのリファレンスを確認します。
リクエストの本文には、少なくとも 1 つ、最大 2 つの詳細レポートが含まれます。
- 失敗がイベントレベル レポートにのみ影響する場合(または集計可能レポートにのみ影響する場合)は、1 つの詳細レポート。ソースまたはトリガーの登録失敗には理由が 1 つしかないため、失敗ごと、レポートタイプ(イベントレベルまたは集計可能)ごとに 1 つの詳細レポートを生成できます。
- 失敗がイベントレベル レポートと集計可能レポートの両方に影響する場合は、2 つの詳細レポート。ただし、イベントレベル レポートと集計可能レポートの失敗理由が同じ場合は、1 つの詳細レポートのみが生成されます(例:
trigger-no-matching-source)。