
关于调试归因报告的第 2 部分(共 3 部分)。设置调试报告。
术语库
- 报告来源是用于设置归因报告来源和触发器标头的来源。浏览器生成的所有报告都会发送到此源。在本指南中,我们使用
https://adtech.example作为示例报告来源。 - 归因报告(简称“报告”)是包含您请求的衡量数据的最终报告(事件级报告或可汇总报告)。
- 调试报告包含有关归因报告或者来源或触发器事件的其他数据。收到调试报告并不一定表示存在问题!调试报告有两种
- 过渡调试报告是一种调试报告,需要设置 Cookie 才能生成和发送。如果 Cookie 未设置且第三方 Cookie 被弃用,过渡调试报告将不可用。本指南中描述的所有调试报告都是过渡性调试报告。
- 成功调试报告用于跟踪成功生成归因报告。它们与归因报告直接相关。从 Chrome 101(2022 年 4 月)开始,已提供成功调试报告。
- 详细调试报告可以跟踪缺失的报告,并帮助您确定缺失报告的原因。它们分别用于表明浏览器未记录来源或触发器事件(这意味着浏览器不会生成归因报告)以及由于某种原因无法生成或发送归因报告的情况。详细调试报告包含一个
type字段,用于说明未生成来源事件、触发器事件或归因报告的原因。从 Chrome 109(2023 年 1 月稳定版)开始提供详细调试报告。 - 调试键是您可以在来源端和触发器端设置的唯一标识符。通过调试键,您可以映射基于 Cookie 的转化和基于归因的转化。将系统设置为生成调试报告并设置调试密钥后,浏览器会将这些调试密钥添加到所有归因报告和调试报告中。
如需了解我们的文档中使用的更多概念和关键术语,请参阅 Privacy Sandbox 术语表。
有实施方面的问题?
如果您在设置调试报告时遇到任何问题,请在我们的开发者支持代码库中创建问题,我们会帮助您排查问题。
准备设置调试报告
在设置调试报告之前,请按以下步骤操作:
检查您是否已应用 API 集成的最佳实践
检查您的代码是否通过功能检测进行门控。为确保 API 未被 Permissions-Policy 阻止,请运行以下代码:
if (document.featurePolicy.allowsFeature('attribution-reporting')) {
// the Attribution Reporting API is enabled
}
如果此功能检测检查返回 true,则表示在运行检查的上下文(网页)中允许使用该 API。
(测试阶段不需要:检查您是否已设置 Permissions-Policy)
解决基本的集成问题
虽然调试报告有助于您大规模检测和分析损失,但有些集成问题可以在本地检测到。如果存在来源和触发标头配置错误问题、JSON 解析问题、不安全上下文 (non-HTTPS) 以及其他导致 API 无法正常运行的问题,系统会在 DevTools 的问题标签页中显示这些问题。
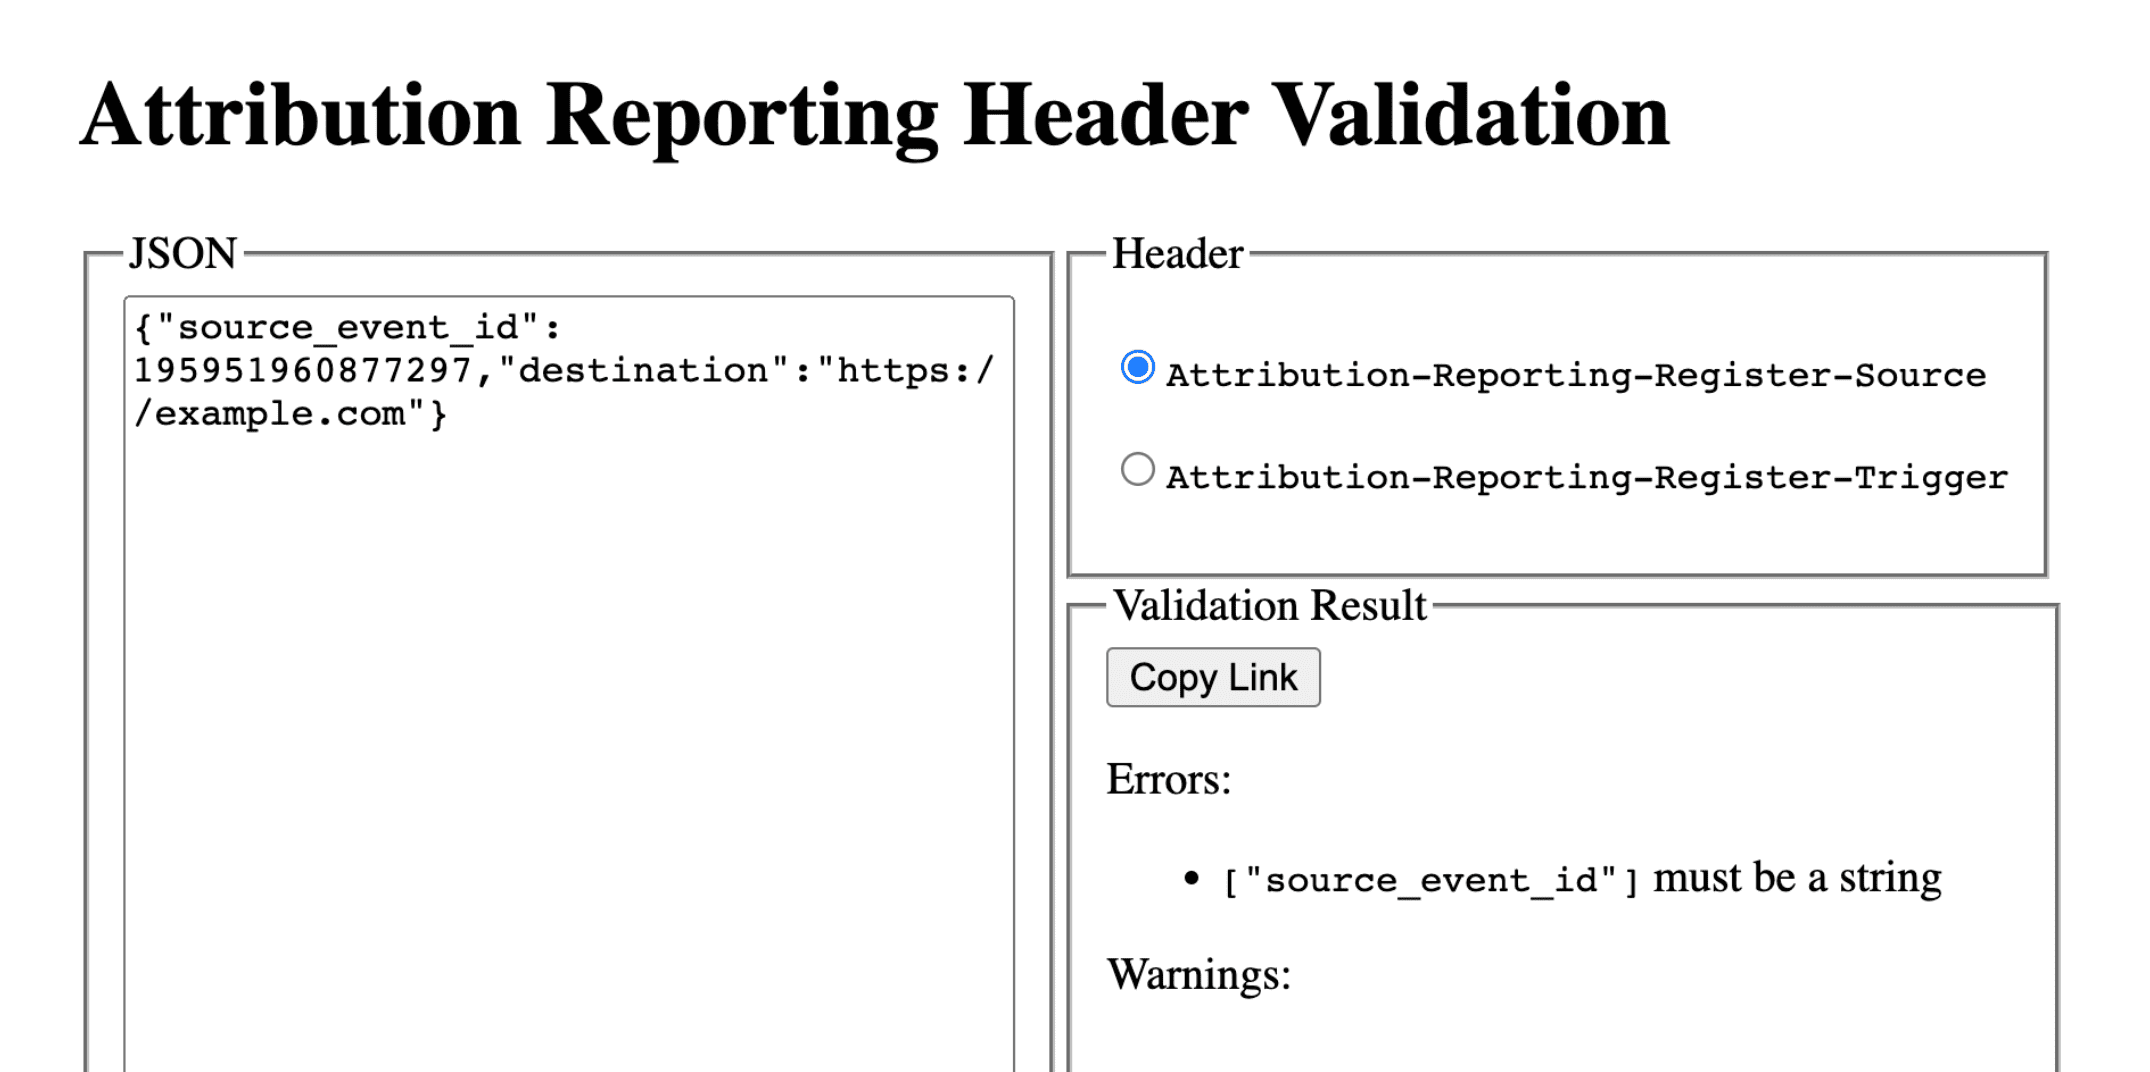
开发者工具问题可能属于不同类型。如果您遇到 invalid header 问题,请将标头复制到标头验证器工具中。这有助于您识别并修正导致问题的字段。
验证 Attribution Reporting 标头
您可以使用标头验证器来验证与 Attribution Reporting API 相关的标头。您可以监控源自浏览器的验证错误,以便于进行 API 调试。
如需选择接收调试报告,请在 Attribution-Reporting-Info 响应标头中添加 report-header-errors。
Attribution-Reporting-Info: report-header-errors
请注意,Attribution-Reporting-Info 是一个结构化字典标头Attribution-Reporting-Info,因此提供布尔值 report-header-errors 键意味着值为 true。
调试报告会立即发送到报告端点:
https://<reporting origin>/.well-known/attribution-reporting/debug/verbose
报告数据以 JSON 对象列表的形式包含在请求正文中,格式如下:
[{
  "type": "header-parsing-error",
  "body": {
    "context_site": "https://source.example",
    "header": "Attribution-Reporting-Register-Source",
    "value": "!!!", // header value received in the response
    "error": "invalid JSON" // optional error details that may vary across browsers or different versions of the same browser
  }
}]
设置调试报告:成功报告和详细报告的通用步骤
在报告来源上设置以下 Cookie:
Set-Cookie: ar_debug=1; SameSite=None; Secure; Path=/; HttpOnly
浏览器会在来源注册和触发器注册时检查是否存在此 Cookie。只有在两次时间点都存在 Cookie 的情况下,系统才会生成成功调试报告。
请注意,对于处于模式 B 的浏览器,可以启用调试报告,其中第三方 Cookie 已停用,以便于测试和为第三方 Cookie 弃用做好准备。对于处于模式 B 的浏览器,您无需设置调试 Cookie 即可启用调试报告。跳至第 2 步,设置调试密钥以生成成功调试报告。
第 2 步:设置调试密钥
每个调试密钥都必须是 64 位无符号整数,格式为以 10 为基数的字符串。 确保每个调试密钥都是唯一的 ID。只有在设置了调试密钥的情况下,系统才会生成成功调试报告。
- 将来源端调试键映射到您认为与调试相关的其他来源时信息。
- 将触发器端调试密钥映射到您认为与调试相关的其他触发时间信息。
例如,您可以设置以下调试键:
- Cookie ID + 源时间戳作为源调试键(并在基于 Cookie 的系统中捕获相同的时间戳)
- Cookie ID + 触发时间戳作为触发调试键(并在基于 Cookie 的系统中捕获同一时间戳)
这样一来,您就可以使用基于 Cookie 的转化信息来查找相应的调试报告或归因报告。如需了解详情,请参阅第 3 部分:Cookbook。
使来源端调试密钥不同于 source_event_id,以便区分具有相同来源事件 ID 的各个报告。
Attribution-Reporting-Register-Source:
{
// … Usual fields for Attribution-Reporting-Register-Source
"debug_key":"647775351539539"
}
Attribution-Reporting-Register-Trigger:
{
// … Usual fields for Attribution-Reporting-Register-Trigger
"debug_key":"938321351539743"
}
设置成功调试报告
本部分中的示例代码会针对事件级报告和可汇总报告生成成功调试报告。事件级报告和可汇总报告使用相同的调试键。
第 3 步:设置端点以收集成功调试报告
设置用于收集调试报告的端点。此端点应与主要归因端点类似,但在路径中添加了 debug 字符串:
- 事件级成功调试报告的端点:
https://adtech.example/.well-known/attribution-reporting/debug/report-event-attribution- 可汇总成功调试报告的端点:
https://adtech.example/.well-known/attribution-reporting/debug/report-aggregate-attribution
- 可汇总成功调试报告的端点:
当触发归因时,浏览器会立即使用 POST 请求向此端点发送调试报告。用于处理传入的成功调试报告的服务器代码可能如下所示(此处是在节点端点上):
// Handle incoming event-Level Success Debug reports
adtech.post(
  '/.well-known/attribution-reporting/debug/report-event-attribution',
  async (req, res) => {
    // Debug report is in req.body
    res.sendStatus(200);
  }
);

// Handle incoming aggregatable Success Debug reports
adtech.post(
  '/.well-known/attribution-reporting/debug/report-aggregate-attribution',
  async (req, res) => {
    // Debug report is in req.body
    res.sendStatus(200);
  }
);
第 4 步:确认您的设置将生成成功调试报告
- 在浏览器中打开
chrome://attribution-internals。 - 确保在事件级报告和可汇总报告标签页中,显示调试报告复选框均处于选中状态。
- 打开您已实现归因报告的网站。完成用于生成归因报告的步骤;这些步骤同样会生成成功调试报告。
- 在
chrome://attribution-internals中:- 检查归因报告是否已正确生成。
- 在事件级报告标签页和可汇总报告标签页中,检查是否也生成了成功调试报告。在列表中,这些路径会以蓝色
debug显示。
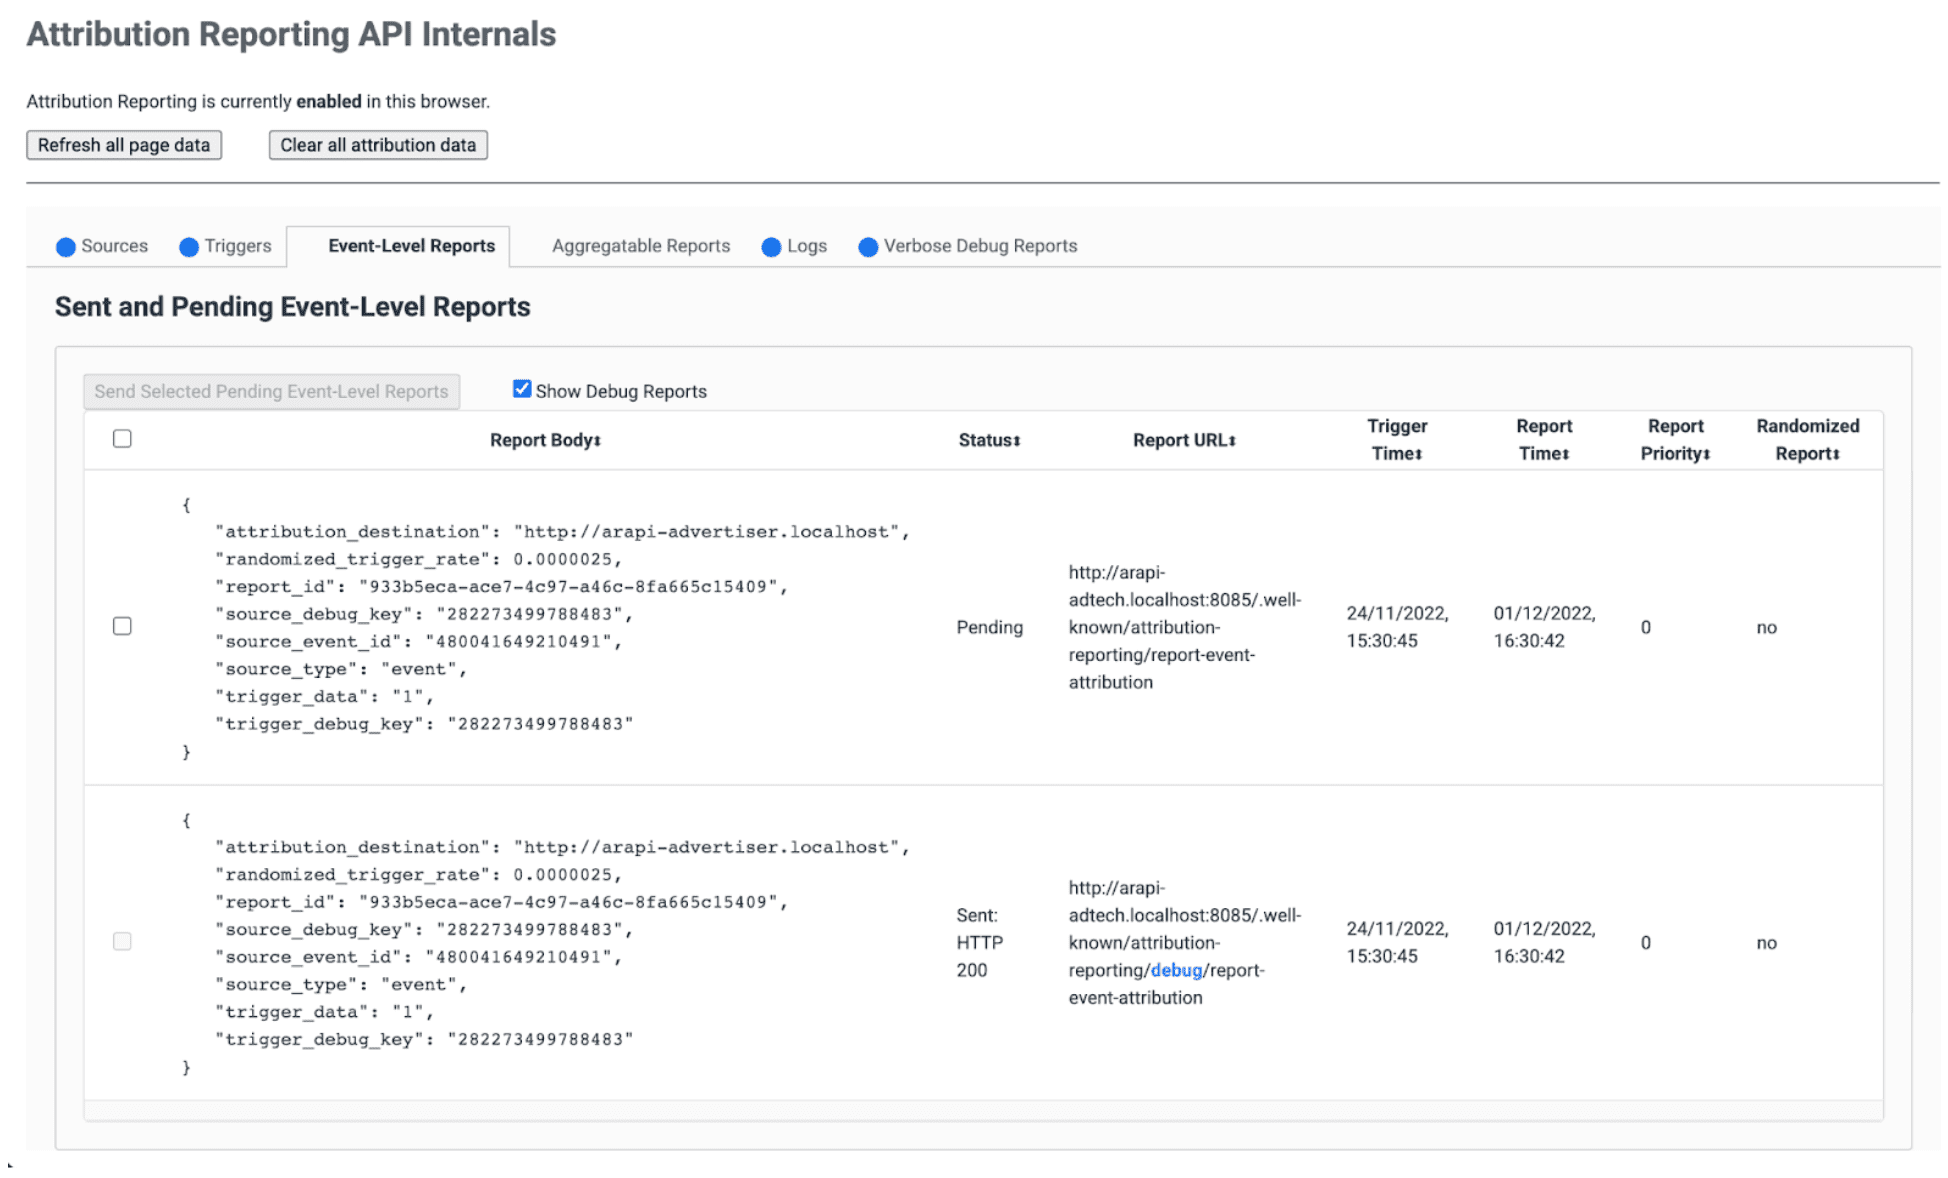
- 在服务器上,验证您的端点是否立即收到这些成功调试报告。请务必检查事件级和可汇总的成功调试报告。
第 5 步:查看成功调试报告
成功调试报告与归因报告相同,同时包含来源端和触发器端调试键。
{
  "attribution_destination": "https://advertiser.example",
  "randomized_trigger_rate": 0.0000025,
  "report_id": "7d76ef29-d59e-4954-9fff-d97a743b4715",
  "source_debug_key": "647775351539539",
  "source_event_id": "760938763735530",
  "source_type": "event",
  "trigger_data": "0",
  "trigger_debug_key": "156477391437535"
}
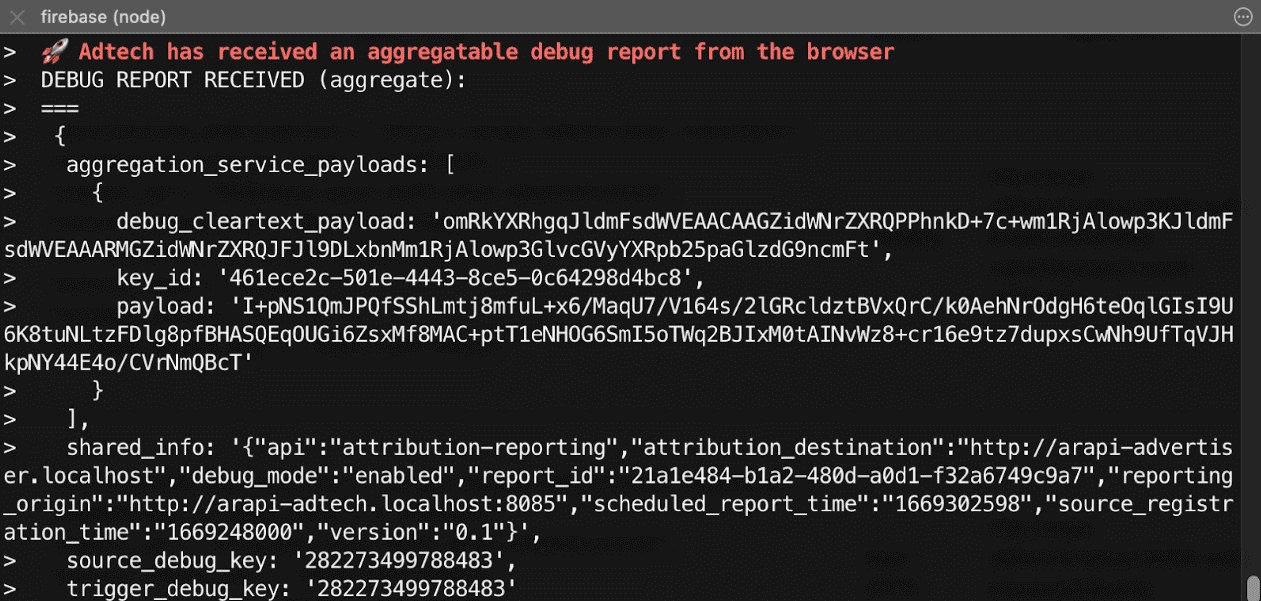
{
  "aggregation_service_payloads": [
    {
      "debug_cleartext_payload": "omRkYXRhgqJldmFsdWVEAACAAGZidWNrZXRQPPhnkD+7c+wm1RjAlowp3KJldmFsdWVEAAARMGZidWNrZXRQJFJl9DLxbnMm1RjAlowp3GlvcGVyYXRpb25paGlzdG9ncmFt",
      "key_id": "d5f32b96-abd5-4ee5-ae23-26490d834012",
      "payload": "0s9mYVIuznK4WRV/t7uHKquHPYCpAN9mZHsUGNiYd2G/9cg87Y0IjlmZkEtiJghMT7rmg3GtWVPWTJU5MvtScK3HK3qR2W8CVDmKRAhqqlz1kPZfdGUB4NsXGyVCy2UWapklE/r7pmRDDP48b4sQTyDMFExQGUTE56M/8WFVQ0qkc7UMoLI/uwh2KeIweQCEKTzw"
    }
  ],
  "shared_info": "{\"api\":\"attribution-reporting\",\"attribution_destination\":\"https://advertiser.example\",\"debug_mode\":\"enabled\",\"report_id\":\"4a04f0ff-91e7-4ef6-9fcc-07d000c20495\",\"reporting_origin\":\"https://adtech.example\",\"scheduled_report_time\":\"1669888617\",\"source_registration_time\":\"1669852800\",\"version\":\"0.1\"}",
  "source_debug_key": "647775351539539",
  "trigger_debug_key": "156477391437535"
}
设置详细调试报告
第 3 步:在来源和触发器标头中选择启用详细调试
在 Attribution-Reporting-Register-Source 和 Attribution-Reporting-Register-Trigger 中,将 debug_reporting 设置为 true。
Attribution-Reporting-Register-Source:
{
// … Usual fields for Attribution-Reporting-Register-Source
"debug_key":"938321351539743",
"debug_reporting": true // defaults to false if not present
}

Attribution-Reporting-Register-Trigger:
{
// … Usual fields for Attribution-Reporting-Register-Trigger
"debug_key":"938321351539743",
"debug_reporting": true // defaults to false if not present
}
第 4 步:设置端点以收集详细的调试报告
设置用于收集调试报告的端点。此端点应与主要归因端点类似,但在路径中包含额外的 debug/verbose 字符串:
https://adtech.example/.well-known/attribution-reporting/debug/verbose
生成详细调试报告时(即未注册来源或触发器时),浏览器会立即使用 POST 请求向此端点发送详细调试报告。用于处理传入的详细调试报告的服务器代码可能如下所示(此处是在节点端点上):
// Handle incoming verbose debug reports
adtech.post(
  '/.well-known/attribution-reporting/debug/verbose',
  async (req, res) => {
    // List of verbose debug reports is in req.body
    res.sendStatus(200);
  }
);
与成功调试报告不同,详细报告只有一个端点。 与事件级报告和汇总报告相关的详细报告都将发送到同一端点。
第 5 步:确认您的设置将生成详细的调试报告
虽然详细调试报告的类型有很多,但只需使用一种类型的详细调试报告即可检查详细调试设置。如果正确生成并接收到这种类型的详细调试报告,则意味着所有类型的详细调试报告也都会正确生成并接收到,因为所有详细调试报告都使用相同的配置并发送到相同的端点。
- 在浏览器中打开
chrome://attribution-internals。 - 在已设置 Attribution Reporting 的网站上触发归因(转化)。鉴于此转化之前没有广告互动(展示或点击),您应该会看到系统生成了
trigger-no-matching-source类型的详细调试报告。 - 在
chrome://attribution-internals中,打开详细调试报告标签页,并检查是否已生成类型为trigger-no-matching-source的详细调试报告。 - 在服务器上,验证端点是否已立即收到此详细的调试报告。
第 6 步:查看详细调试报告
在触发时间生成的详细调试报告包含来源端和触发器端调试键(如果触发器有匹配的来源)。在来源时间生成的详细调试报告包含来源端调试密钥。
浏览器发送的包含详细调试报告的请求示例:
[
  {
    "body": {
      "attribution_destination": "http://arapi-advertiser.localhost",
      "randomized_trigger_rate": 0.0000025,
      "report_id": "92b7f4fd-b157-4925-999e-aad6361de759",
      "source_debug_key": "282273499788483",
      "source_event_id": "480041649210491",
      "source_type": "event",
      "trigger_data": "1",
      "trigger_debug_key": "282273499788483"
    },
    "type": "trigger-event-low-priority"
  },
  {
    "body": {
      "attribution_destination": "http://arapi-advertiser.localhost",
      "limit": "65536",
      "source_debug_key": "282273499788483",
      "source_event_id": "480041649210491",
      "source_site": "http://arapi-publisher.localhost",
      "trigger_debug_key": "282273499788483"
    },
    "type": "trigger-aggregate-insufficient-budget"
  }
]
每份详细报告包含以下字段:
Type- 导致生成报告的原因。如需了解所有详细报告类型以及应根据每种类型采取的操作,请查看第 3 部分:调试实用指南中的详细报告参考信息。
Body- 报告的正文。这取决于其类型。请参阅第 3 部分:调试实用指南中的详细报告参考。
请求的正文将包含至少一个、最多两个详细报告:
- 如果失败仅影响事件级报告(或仅影响可汇总报告),则生成一份详细报告。来源或触发器注册失败只有一个原因;因此,每次失败和每种报告类型(事件级或可汇总)只能生成一份详细报告。
- 如果失败影响了事件级报告和可汇总报告,则生成两个详细报告;但如果事件级报告和可汇总报告的失败原因是相同的,则只生成一个详细报告(例如:
trigger-no-matching-source)